chartspy
Help users to use echarts,g2plot,KLineChart drawing in python environment
Unlike pyecharts, it does not perform python mapping and secondary abstraction of echarts concepts and attributes, ensuring that the library does not depend on a specific echarts version
-
implemented two-way conversion of python configuration<=>JavaScript configuration
-
offer simple visualization functions like plotly.express
instructions for use
simple mode
from chartspy import *
......
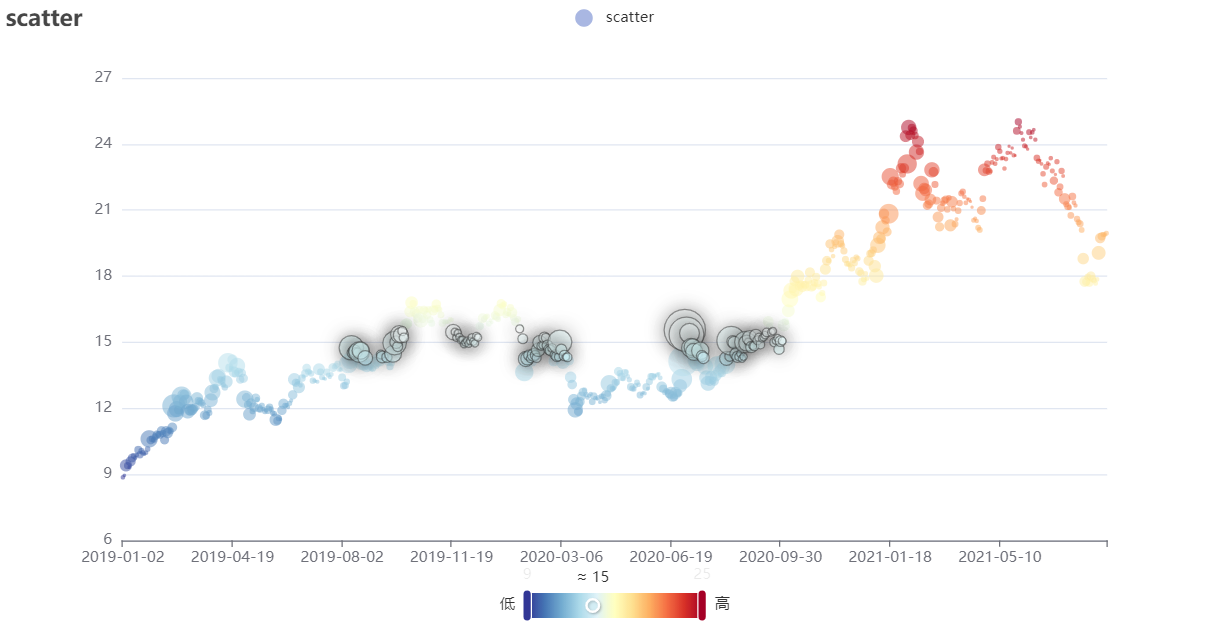
express.scatter_echarts(df, x_field='数量', y_field='价格', size_field='数量', size_max=50, height='250px',
title='scatter').render_notebook()
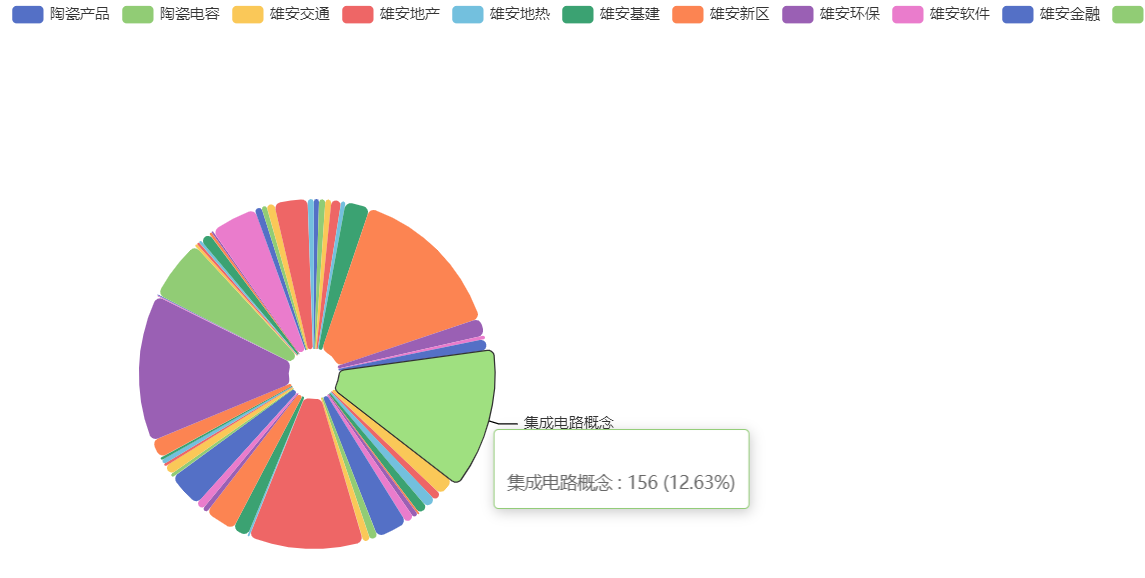
express.pie_echarts(df, name_field='水果', value_field='数量', rose_type='area', title="pie2",
height='350px').render_notebook()
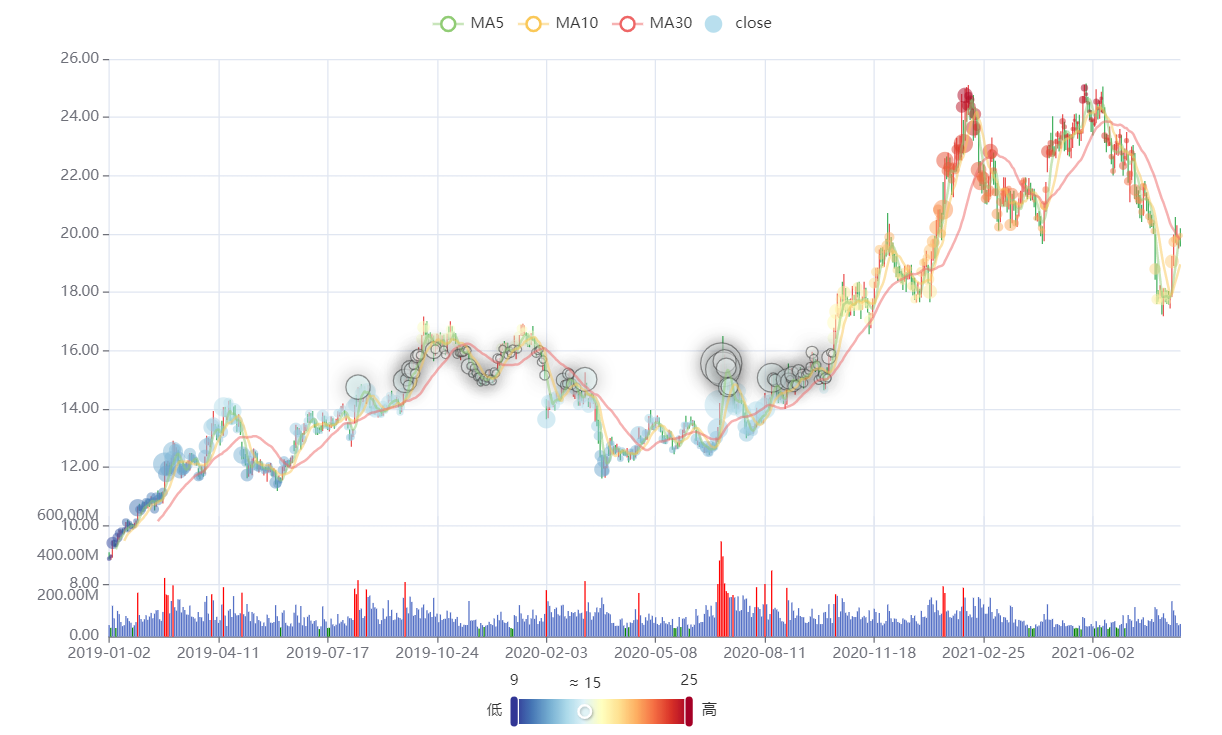
express.candlestick_echarts(df, left_padding='5%', mas=[5, 10, 30], title='平安银行').render_notebook()
advanced mode
handmade
handmade,reference echarts onfiguration manual
from chartspy import *

options = {
    'xAxis': {},
    'yAxis': {},
    'series': [{
        'symbolSize': 20,
        'data': [
            [10.0, 8.04],
            [8.07, 6.95],
            [13.0, 7.58],
            [9.05, 8.81],
            [11.0, 8.33]
        ],
        'type': 'scatter'
    }]
}
Echarts(options, height='600px', title='散点图测试').render_notebook()
from chartspy import *

# G2PLOT
df = ...
# Echarts
options = {
    'xField': 'time',
    'yField': 'close'
}
G2PLOT(df, plot_type='Line', options=options).render_notebook()
from chartspy import KlineCharts
import tushare as ts

df = ts.pro_bar(ts_code="000001.SZ", adj='qfq')
df.rename(columns={'trade_date': 'timestamp', 'vol': 'volume'}, inplace=True)
KlineCharts(df, main_indicators=['MA', 'SAR'], mas=[5, 10, 30, 60, 120, 250])
semi-automatic
from echarts examples copy js configuration ,auto convert to python dict
convert_js_to_dict(js_str,print_dict=True) will print python configuration dict in console, manually modify after copy and paste
from chartspy import *

js_str = """
{
    xAxis: {
        type: 'category',
        data: ['Mon', 'Tue', 'Wed', 'Thu', 'Fri', 'Sat', 'Sun']
    },
    yAxis: {
        type: 'value'
    },
    series: [{
        data: [820, 932, 901, 934, 1290, 1330, 1320],
        type: 'line',
        smooth: true
    }]
}
"""
options = Tools.convert_js_to_dict(js_str, print_dict=False)
Echarts(options, height='300px', width='300px').render_notebook()